
Credit Card Rewards vs Cash Back: The Real Math in 2027
Interchange rate changes and airline devaluations have reshuffled the rewards deck. Here's the hard math on what your points are actually worth in 2027.
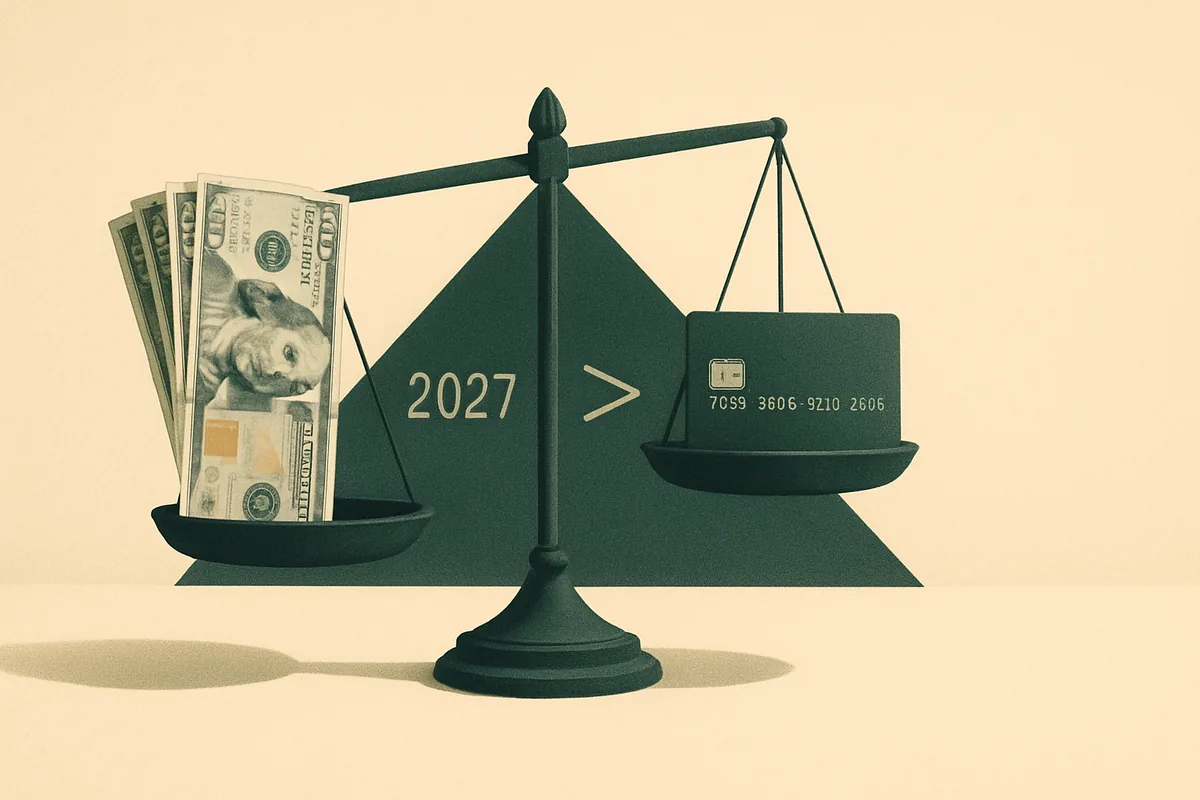
The credit card rewards industry runs on a quiet subsidy most people never see: interchange. Every time you swipe a Visa Signature card at a coffee shop, the merchant pays roughly 2.0–2.4% of the transaction to the card network and issuing bank. That fee funds your points, your lounge access, your 2% cash back — all of it. And in 2027, that funding model is under more pressure than it has been in a decade.
Two forces collided in late 2025 and early 2026. First, the Federal Reserve's Regulation II amendment — finalized in October 2024 — cut the debit interchange cap from 21 cents to roughly 14.4 cents per transaction, effective July 2025. While that change technically targets debit, it set a political precedent that spooked credit issuers. Second, the Credit Card Competition Act resurfaced in the 119th Congress with fresh co-sponsors, threatening to mandate network routing competition on credit cards the way Durbin did for debit. The result: several major issuers quietly trimmed their most generous earn rates in Q1 2026, hoping nobody would notice the fine print. Plenty of people didn't. You should.
What Interchange Actually Pays For
Understanding the rewards math starts with the economics behind it. On a premium rewards card — think Visa Infinite or World Elite Mastercard tier — interchange to the issuer typically runs between 2.10% and 2.40% of purchase volume, according to Visa's published interchange rate schedules. The issuer keeps roughly half of that after paying network fees, fraud losses, and operational costs. The other half-ish funds rewards.
That math explains why a flat 2% cash-back card is essentially a break-even product for the issuer — they're handing you back nearly all the margin they earn on interchange. They make it up on the roughly 40% of cardholders who carry a balance, paying APRs that averaged 21.76% in Q4 2026, per Federal Reserve G.19 consumer credit data. If you pay your statement in full every month, congratulations: you are the most profitable customer type for rewards card math but the least profitable for the issuer.
Cash Back in 2027: The Honest Numbers
Cash back sounds simple. It isn't, once you factor in caps, category rotations, and activation requirements.
Here's what a realistic annual cash-back yield looks like for a median U.S. household spending $31,400 per year on credit (a figure derived from Bureau of Labor Statistics 2025 Consumer Expenditure Survey categories that typically go on cards):
- Flat 2% card (no annual fee): $628 gross. Net after zero fee: $628.
- 5/5/5/1 rotating-category card (no annual fee): Assuming 60% of spend hits 5% categories at the $1,500 quarterly cap, the blended rate is closer to 2.8%. Gross yield: $879. But activation failures and cap overflows typically erode ~15% of theoretical gains. Realistic net: $747.
- Premium cash-back card ($95 annual fee, 3% groceries/gas/dining, 1.5% else): On BLS-proportioned spend, blended rate hits ~2.4%. Gross $754, minus fee: $659.
The rotating-category card wins on raw math — but only if you treat it like a part-time job. Most people don't.
Travel Rewards: Where the Leverage Lives (and the Traps)
Travel rewards have always offered the possibility of outsized value — 3, 4, even 6 cents per point when you redeem into business-class flights. That potential is real. So is the devaluation treadmill.
American Airlines' AAdvantage program devalued twice between 2024 and 2026, moving most transatlantic business-class awards from 57,500 miles to 75,000 miles one-way, a 30.4% inflation of the cost. United MileagePlus followed a similar pattern with dynamic pricing that effectively raised average redemption costs by 18–22% on peak dates, based on user-sourced analyses published by The Points Guy and corroborated by Bloomberg's 2026 loyalty program coverage.
Here's the honest framework for evaluating a travel card:
- What is your realistic cents-per-point (CPP) on redemption? Economy award travelers average 1.2–1.5 CPP. Business-class sweet-spot redeemers average 3.5–5.5 CPP. If you fly economy domestically 95% of the time, your travel card isn't delivering travel card value.
- What is the effective earn rate after annual fee? A card earning 3x points worth 1.5 CPP yields a 4.5% effective rate — only if you hit the bonus categories consistently.
- Do you have enough annual spend to unlock the card's break-even? On a $550-fee card requiring $4,000 in perks utilization (lounge access, travel credit, Global Entry fee), you need to actually use those perks. Nearly 28% of premium cardholders paid for perks they didn't use in 2026, according to a CFPB market monitoring report published March 2026.
- What's your redemption timeline? Points sitting unused for 18+ months carry meaningful devaluation risk. Airlines restructure programs; hotel chains change partners. Illiquid rewards are a depreciating asset.
The rule of thumb that actually holds: If you fly at least four round trips per year, stay in hotel rooms 20+ nights, and have the organizational discipline to track category bonuses and transfer partners, travel rewards beat cash back by a margin of 40–80% in effective yield. If any of those three conditions is false, the flat 2% cash-back card is almost certainly your highest-value instrument.
The Interchange Risk Nobody's Pricing In
Here's where the 2027 picture gets genuinely uncertain. If the Credit Card Competition Act passes in any form — even a watered-down version requiring two unaffiliated network options on credit cards, mirroring the Durbin debit model — issuer interchange revenue on affected cards could fall 25–40 basis points. That's not speculative; it's the documented effect Durbin had on debit rewards programs after 2011, when virtually every major bank eliminated debit rewards within 18 months of the cap taking effect.
Credit rewards are better insulated than debit was, because premium rewards cards held by high-income customers are explicitly carved out of most legislative proposals. But mass-market rewards cards — the 1.5% and 2% products aimed at everyday consumers — would face genuine margin pressure. Issuers will respond the way they always do: by reducing earn rates, adding annual fees to previously free products, or tightening approval criteria.
The practical implication: lock in multi-year value from cards you already hold, don't assume today's earn structure persists, and avoid accumulating large point balances in programs with weak transfer partner ecosystems. Transferable currencies — Amex Membership Rewards, Chase Ultimate Rewards, Citi ThankYou Points — provide optionality that airline-specific miles cannot.
Building a Two-Card Optimization Stack
For most households in 2027, the mathematically optimal setup is a two-card stack, not a six-card juggling act:
Card 1 — Category multiplier card (with or without annual fee): Target a card that earns 3x or higher in your top two spending categories. For the median American household, those are groceries (averaging $6,800 annually per BLS 2025 data) and dining or gas. A 3x multiplier on a currency worth 1.5 CPP yields an effective 4.5% return in that category.
Card 2 — Flat-rate catch-all: Everything that doesn't hit a bonus category goes on a no-annual-fee 2% cash-back card. No thinking required. No activation. No category caps.
This two-card structure captures 80–85% of the theoretical maximum value a ten-card setup could deliver, with approximately 10% of the cognitive overhead. The optimization gap between a two-card and a five-card setup is typically $120–$220 per year for a median household — real money, but not worth the complexity tax for most people.
Credit Card Optimization and Your Cash Flow Layer
Rewards optimization doesn't happen in isolation. The single biggest destroyer of credit card value isn't a bad earn rate — it's carrying a balance. At a 21.76% average APR, a $3,000 revolving balance costs you $653 per year in interest. No rewards program offsets that.
This is why your spending visibility layer matters as much as your card selection. Knowing, in real time, which dollars are genuinely available to spend — not your statement balance, not your credit limit, but your actual discretionary cash — is what separates reward-maximizers from reward-rationalizers.
If you want a cleaner picture of how your rewards spending maps to your real cash position, Safe to Spend 365 was built specifically for this problem: it surfaces your true discretionary balance after bills, subscriptions, and scheduled transfers — so you can charge confidently to rewards cards without accidentally funding points with interest payments. Pair that with the budget intelligence layer inside Ember360 to see which category spend is actually hitting your bonus tiers versus bleeding into base-rate transactions. The combination turns credit card optimization from a spreadsheet exercise into something you can run on autopilot.
For developers building rewards-aware financial tools or personal finance apps, the AtlasForge Financial API exposes transaction categorization and interchange-class tagging that makes category-bonus tracking programmatic rather than manual.
The Bottom Line
The rewards landscape in 2027 is not broken — but it rewards precision more than enthusiasm. The households winning at credit card optimization share three habits: they know their actual spend by category (not estimates), they choose cards based on their real redemption behavior rather than aspirational travel plans, and they treat point accumulation as a short-to-medium-term asset, not a savings account.
Do the math on your own numbers. A flat 2% cash-back card on $31,400 of annual spend puts $628 in your pocket with zero complexity. A well-chosen two-card stack, used strategically, can push that to $950–$1,100. The difference is meaningful. The effort required to capture it is not nearly as large as the rewards industry's marketing complexity makes it seem — or as small as the "just pick one card" crowd would have you believe.
Interchange economics are shifting. Redemption values are eroding. The window for extracting maximum value from today's reward structures is open, but it isn't permanent. The best time to optimize your stack was 2024. The second-best time is now.
Ready to build on AtlasForge?
Get sandbox API keys in 60 seconds — or install the Safe to Spend 365 app.